

What is Process Intelligence?
And why you should care

Process Intelligence is a term that you might have encountered a bit more often these days, and one big driver of this is the popularity of Process and Task Mining. However, there are also voices out there who think that there is more to Process Intelligence than mining, and some who are thinking it is just a subset of traditional Business Intelligence (BI) and wonder what all the buzz is about.
This article attempts to bring some clarity into this conversation, starting with an analyst definition and a spin on this, while then looking at the underlying problem, the new(-ish) approach to it, and the different methods that exist in some cases for decades and already had their “day in the sun.”
What is Process Intelligence?
Let’s start our conversation by looking at how Bernhard Schaffrik from Forrester defines Process Intelligence:

It is interesting that Forrester is focusing on the software more than the discipline, which might be a function of the context in which the analyst report was written.
I have seen many instances where clients were seeing Process Intelligence as a pure software category spiel. However, nothing could be further from the truth. We will discuss the different aspects of Process Intelligence further below and in a separate series of articles in which we take a look at the six steps for a successful process mining project.
So, what is the specialty of Process Intelligence according to Forrester?
It is the mining technology, the focus on the complete process that includes not only system tasks (which might be a challenge to capture if you just use process mining software and not also task mining software), and the focus on decision-making … But notice the word “enabling”—he didn’t say “provide,” which is a reflection of the fact that there is a lot of human work to be done to get to the point where one can decide about process or other improvements that then later will be implemented in projects.
What is the problem?
Let’s take a step back and take a look at the issue that exists in how organizations run their processes.
There is a massive lack of visibility in all processes that don’t create physical goods that you can watch, like a production process or a retail sales process where you can see the capacity of the process with the naked eye, answering the question of “What is the output of my process?” For most processes, the output is somewhat hidden—it is the amount of loans that have been underwritten or the number of candidates being hired and ready for onboarding. We also cannot easily see how long a process or its instances take and if Service Level Agreements are met.
But these are no new problems, and there were attempts to bring in this visibility by using process analysis techniques and BI in the past, and plenty of people have made money by providing services to create visibility and analyze processes.
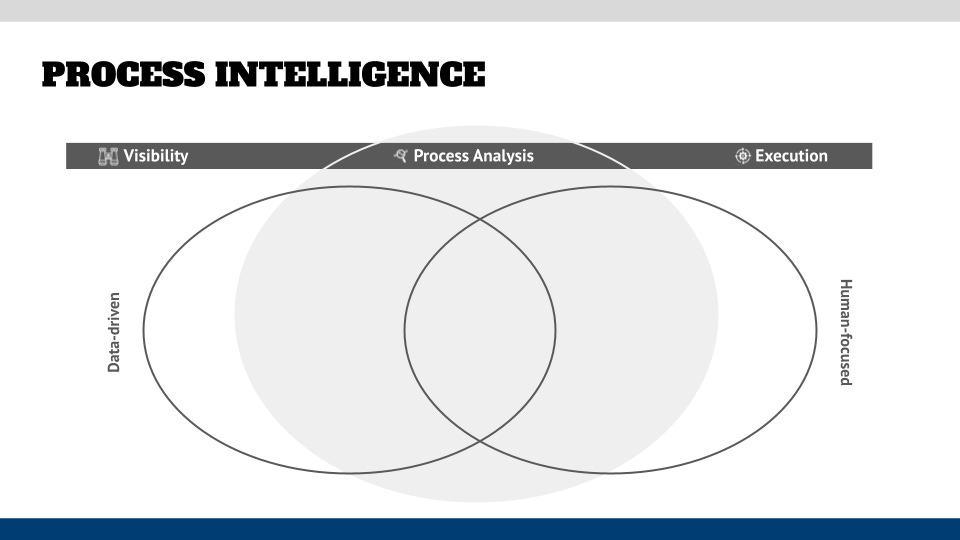
The ultimate goal in all of these efforts was (and is) that you change the execution of the runtime processes and create results and changes. This can be changes in the process itself, the organization, systems, etc. And you need to be able to measure the performance of these changes then as well. The graphic below shows the problem in an overview.
The new characteristic of process analysis
The key aspect of the difficulty with process visibility is not that we cannot measure process performance—back in the day people were observing the process with stopwatches and gathering the results on sheets of paper. There is a new focus on technology that allows an automated capturing of visibility data that has a much higher quality and objectivity than anything else that has been captured manually before.
Mining technologies allow capturing *all* activities—as Forrester has defined above—independent of whether they leave traces in systems (Process Mining) or are captured by observing unstructured activities on user machines (Task Mining). They also calculate metrics that can give context and insights out-of-the-box, like durations (minimum, maximum, average, median times), and so on, which would take some effort to calculate otherwise.
This allows analysts not only to get to results faster, but they also are based on facts that are in the data set, and there is just a limited amount of conversation possible—for example, when the context of a situation is needed when you see an interesting visualization in the process mining charts. This improves the quality of the decisions made significantly because the subjectivity, “Is what I hear from that Subject Matter Expert the main information, or is he telling me what he wants me to hear?” — will be taken out of it.
The big challenge with mining (and other) tools is that they just support decision-making but don’t make the decision for you. You could trust generative AI tools for this, and we will see a lot of them being built into any tool that we use soon. But at the core, they are just guessing the next word of an answer by calculating probabilities.
Would you risk the future of your company by trusting a probability calculation that sometimes can lead to “hallucinations” of the AI software? I am skeptical of this and would rather see AI support more traditional process analysis techniques in the form of “little helpers” that save time in doing the busywork but have a human identify recommendations and make decisions on changes.
How do various analysis techniques fit into this continuum?
Process analysis is not a new thing, and some methods have been around for decades and had their heyday in some cases decades ago but are still relevant. And we will see an integration of AI into the underlying tools, which might make them more powerful and accessible for users.
The figure below shows various process analysis methods mapped on the Venn diagram:
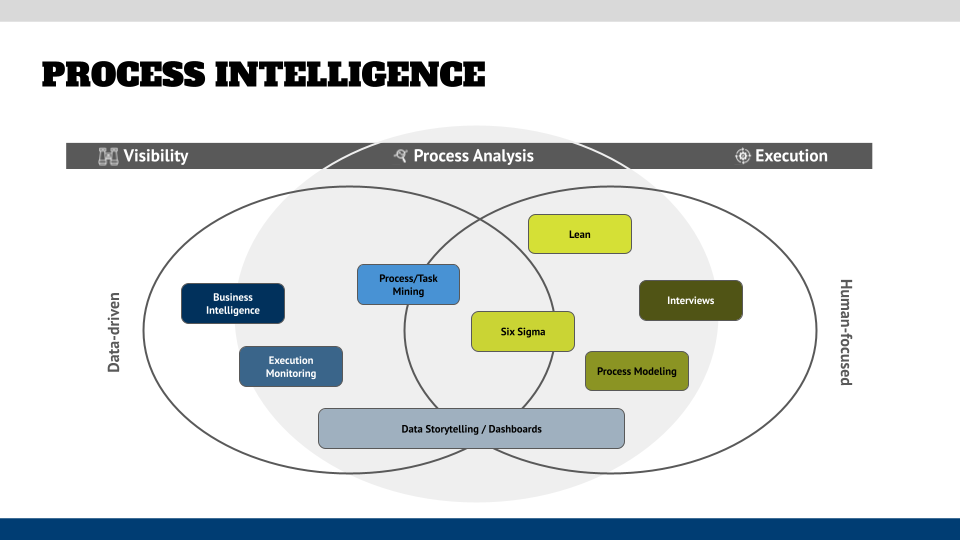
Let’s take a brief look at each method:
Business Intelligence is the practice of creating visibility in how the business is doing by connecting to source systems and visualizing metrics in dashboards. It is the grandfather of what is done now in modern mining tools, but the success of it depends on the creativity and skill of the creator of a dashboard to convey the right information to the right stakeholder.
One additional drawback of BI is also the fact that mostly lagging indicators are used for the visualization, and predictive technology is not widely implemented in the BI tools. They are also not necessarily process-oriented, even though some vendors provide process mining plug-ins for BI tools like PowerBI or Qlic.Execution Monitoring is typically built into automation/workflow tools and can be configured to show process metrics. Unfortunately, they typically are focused on the currently running processes in the system (that run in the one system that has this functionality built in but might have difficulties including data from other runtime systems in the process) and are not focused on creating a higher-level summary of all processes and helping identify patterns of process performance. Independent of the shortcomings, they provide insights into the execution and have alerting/notification capabilities if something goes wrong. And some runtime tools also allow exporting data that then can be used in traditional BI tools or dashboards.
Process/Task Mining tools fill that gap. They are designed to be process-centric and are fed by multiple systems in the process. However, they might have different levels of analysis tools built in and cannot bring in non-process metrics for visualization purposes. Some Process Mining tools can export data to BI tools and have machine-learning/AI capabilities that can give predictions on how cases might end in the future. They can also trigger notifications/alerts and trigger actions in runtime tools. However, they are not necessarily complete regarding their analysis capabilities, and Simulation or detailed statistical analysis might be in a different module of a vendor’s platform.
Six Sigma is a method to fill this gap. It is meant to calculate deviations in metrics that typically are used to improve the quality of processes (“How well is it executed?”) and reduce defects.
Every so often this can be a bit “nerdy” for the regular analyst and go into statistical details that they might see as “overdoing things.” Independent of that, the statistical and data-driven approach that Six Sigma brings to the table will improve the quality of the analysis, and a solid understanding of the statistical approach will be helpful in mining projects as well.Lean is another methodology that aims to find waste in processes, such as overproduction, defects, inventory, etc. Those shall be optimized and can be helpful to give your mining projects an initial focus if your client has trouble finding hypotheses for (bad) process performance. It also comes with various visualization and analysis approaches, like Fishbone Diagrams, that are also helpful in other analysis types—and it is often combined with Six Sigma. I highly recommend gaining a good understanding of the Lean method for the average Business Analyst without the need for a formal “belt” certification (Green Belt, Black Belt, and so on).
For a long time, Process Modeling was the analysis technique of choice—visualize the content in a diagram and find consensus on how work is done or should be done. Add objectives and measurements to them (current state and future state), and run a couple of reports on the diagrams to find improvement ideas. In a more advanced approach to this, tools like Process Simulation were used to create a performance baseline and create scenarios to resolve bottlenecks and other unwanted behaviors of the process.
Interviews are the easiest analysis technique—talk with as many people as possible (process performers, process owners, system owners, etc.) and see what “bubbles up” or if your initial understanding of the problems is validated.
Even though it sounds as if Interviews are the least professional analysis technique, they are still needed in many other approaches as well—the interview partners who have done the process for many, many years will give you the context and the details of the process and thereby deliver the context for your analysis and ultimately the improvement opportunities that you will identify. However, the risk with this technique is that you are dealing with people, and they are highly subjective—they might just tell you what they want you to take away, they might have a biased perspective on the process and its issues, or they might just think of process exceptions while the majority of process instances might run smoothly within the defined service levels.The last technique on the list is relatively new and might be applied to all other methods: data storytelling and dashboarding. While dashboards are used in BI and other approaches, they might be considered a technical thing that visualizes information. The risk is that there is no context to the data that is shown. The context that you get from interviews will allow you to tell a story with the underlying data and therefore transform it into information and knowledge … and sometimes wisdom when you can see what you might not want to do ;-) Data storytelling is a skill that I have not seen in many Business Analysts or Dashboard Developers, who might approach the creation of them from a more technical view (“Which widget do you want for that data, and where on the canvas should it be?”).
As you might have guessed by now, to do a proper process analysis, you will have to take pieces of each methodology and combine them to fit your situation. If you are doing a process mining project, for example, you will have to do interviews with stakeholders but also extract and transform process data to show them in dashboards. These dashboards should be aligned to the hypotheses of process performance that drive your analysis.
What does that mean for me implementing Process Intelligence?
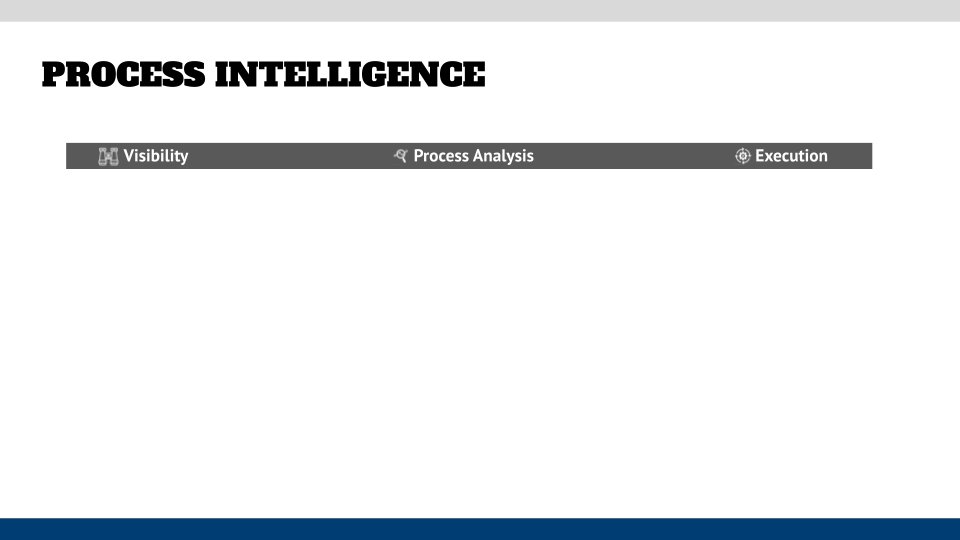
Given the information above, it is clear that the Forrester definition falls a bit short—and it slaps the title “Process Intelligence” on Process/Task Mining tools. When you start with your Process Intelligence implementation, I recommend focusing on the three steps that we outlined in the beginning:
Create visibility: this can be the creation of dashboards (as the BI folks do) or the creation of models and diagrams, which is what traditional Business Analysts have done, and then add performance data to these artifacts.
In both cases the objective is clear—get a performance baseline and make it visible, because only what you see can be improved.Analyze the process: combining data-driven and human-focused approaches is the right way going forward. What you want, though, is an analysis result that is aligned to objective goals and not being tinted by the perspective of “important” stakeholders. Your recommendations of opportunities should be based on facts and be reproducible and understandable by another person.
Execution: The best ideas are worth nothing if you don’t change things and improve them. This means that your recommendations need to be realistic from an implementation perspective—this includes things like feasibility, cost, or organizational/technical readiness for your ideas.
When you implement your change, you should always think of the KPIs and metrics that you have defined and make it an integral part of your solution design to capture those and compare them with the baseline metrics that you identified in the previous steps and were used in your process analysis.